WAMC's broadcast area is pretty darn White, but Roundtable panels are even Whiter: Racial politics of The Roundtable
Daily racial inclusion disproportionately included Whites; all other racial groups appeared below their proportions in WAMC's broadcast area, data on a full year of episodes shows.
Comparing racial balance on daily panels with the demographics of WAMC’s broadcast area
This post presents data on a full year of Roundtable episodes to explore the third research question of this series. That question asks, How do daily patterns of racial representation on The Roundtable compare with the racial demographics of WAMC’s broadcast area and home community, the City of Albany, New York?
The demographics of WAMC’s listening area constitute an excellent context to assess the proportionality of daily racial inclusion on The Roundtable. Comparison with broadcast area demographics also provides means to evaluate how well the program implements the station’s own diversification policies.1 After all, those policies specify proportionality with the broadcast area as a standard for diversity in programming. “The overall goal of WAMC is to provide programming as varied as the human experience” and to do so by creating “programs that celebrate the diversity of our broadcast and live audience.” The policy names categories of diversity for program inclusion, including “race and ethnicity” and “geographic location.” Successful implementation of that policy should reflect the basic proportions of the communities in the broadcast area. Let’s see how closely daily racial demographics on The Roundtable match the diversity of the station’s broadcast demographics.
Demographics of WAMC’s broadcast area
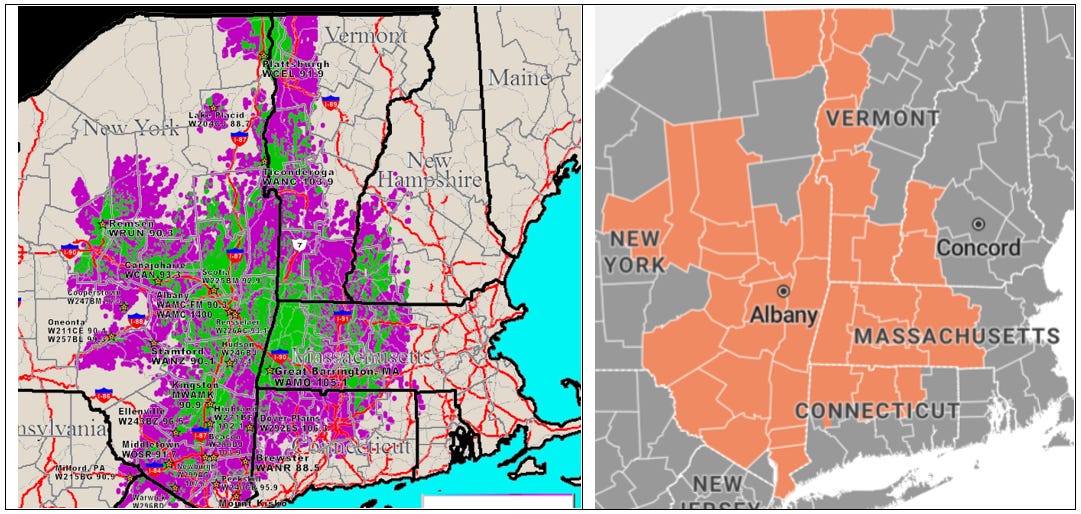
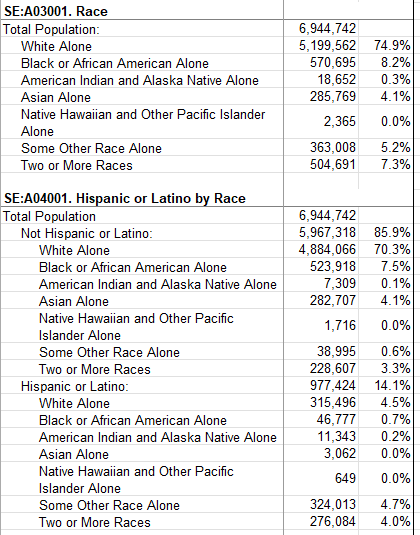
WAMC’s broadcast area encompasses approximately 37 counties across several states constituting a total population of nearly 7 million. I drew race and ethnicity data for those 37 counties from the US Census tool, Social Explorer (Figure 1), excluding counties for which WAMC’s map indicates < 50% of geographic coverage. The resulting data provides racial and ethnic population counts which I use to compare with my counts of racial ethnic inclusion on The Roundtable’s guest list and panels. The ACS data shows total population for the 37 counties is 6.9 million, 74.9% of whom reported as “White alone.”2
Figure 1. WAMC’s Coverage Map with corresponding counties (n=37) in US ACS 5-year data as accessed through Social Explorer, a US Census research tool.
Despite some variation, daily racial inclusion on The Roundtable consistently featured Whites disproportionately more than their share of the broadcast population. Figure 2 illustrates this disproportionate relationship using previously discussed [CITE] daily racial inclusion divided evenly by number of episodes. The 10-19% White advantage shown in the chart translates to a 14-25% inflation of broadcast community proportions.3 Figure 3 represents comparison with the broadcast community through the change-over-time data as divided by racially significant news events and shows almost the same disparity, with Whites over-represented by 10-18%, a 14-24% expansion from community proportions.
Figure 2.
Figure 3.
Over-representation of Whites came at the expense of Blacks, Latino/as, Asians, American Indians, and persons of Arab ancestry as compared to the racial demography of WAMC’s broadcast area (Figure 4). The overall 88% average daily White inclusion rate on The Roundtable constitutes an 18% increase over White proportions in the 37-county broadcast community. The 6.2% daily inclusion rate for Black panelists on The Roundtable translates to a 25% decline from broadcast community demographics of 8.2%. Asians appeared at 85% below community proportions, Latino/a 70% below, Arab/MENA 28% below, with American Indians receiving no inclusion. Despite their total absence on The Roundtable, the WAMC broadcast area includes over 18,000 Native American people and over 40,000 people of Arab/Middle East ancestry, ACS data shows.4
Figure 4.
The Roundtable and the City of Albany
Finally, the highly limited racial diversity on The Roundtable must also be placed in context with the high racial diversity of the show’s base of production in Albany, New York. Viewed from the demographics of Albany, daily Roundtable panels inflated White presence by 65% and decreased presence of Blacks by 78%, Asians by 91%, Latino/a by 57%, Arab/MENA by 66%, and erased the city’s small American Indian presence. Some may argue that it is inappropriate to compare diversity on The Roundtable with the City of Albany (I bet I will hear this response on social media). Yet in doing so, I am in the good company of recent Roundtable panelists who also recognize that Albany’s diversity should be considered as part of ethical representation on the program and station.
Figure 5.
Dan Irizarry, activist and founder of Capital District Latinos, speaking at The Roundtable’s previously mentioned DEI event, noted that WAMC’s facilities “sit in a city where there are 10,000 Latinos or more, the signal reaches . . . probably a couple of hundred thousand Latinos, and yet WAMC does not really have programming that reaches out to that community . . . What is the responsibility of a station like WAMC, a public radio station, to provide representation in its programming, but also to be a significant corporate citizen?”5 Dr. Alfredo Medina, Jr., DEI panelist and Diversity Officer at Bennington College, responded affirmatively. “[A]s a public radio [station] I do believe WAMC has a responsibility to try to target and represent all of its listeners.”6 The data I share above is strong evidence that WAMC and The Roundtable are not fulfilling that responsibility to Albany or the larger broadcast community.
Conclusion: daily racial inclusion on The Roundtable is not proportionate to WAMC’s broadcast area demographics
This post showed that the daily presence of White panelists on The Roundtable is not proportional to the racial demographics of WAMC’s broadcast area. Average daily White inclusion on Roundtable panels ranged 85-94%, amounting to a 14-25% inflation of their 75% proportion of the broadcast area. Average inclusion of all other racial/ethnic groups on daily Roundtable panels dramatically shrank in comparison with their proportions in the broadcast area: Black panelists -25%, Asians -85%, Latino/a -70%, Arab/MENA -28%, and American Indians received no inclusion.
The measure of average daily racial inclusion obscures a deeper imbalance: All Arab/MENA panelists appeared in the final weeks of the study, marking their absence across 11 straight months following the start of the Israel/Gaza war. The newsworthiness of Arab/MENA, Palestinian, and Israeli perspectives is emphasized by the fact that Roundtable panels regularly, at times daily, discussed that war during those 11-months. The extended duration of those exclusions and discussions suggests an editorial practice that treats Arab/MENA people as legitimate subjects of discussion but not legitimate participants in discussions. That Palestinians were completely absent from the year of Roundtable episodes — and remain absent to this day — creates a powerful suggestion to audiences that Palestinians do not legitimately belong as participants in news discussions.
The data I so far present simply does not evidence The Roundtable’s dedicated implementation of WAMC’s diversification policies. Did program producers simply fail in their attempt to increase the diversity of their guest list and daily panels? If so, what were the challenges that hindered their strategic practices of diversification? For that matter, what practices are they using to pursue diversity? It is also possible Roundtable producers gave little or no priority to diversifying the guest list and daily panels. They might have added panelists-of-color in Sept/Oct of 2024 in response to growing public awareness of diversity problems. In any case, the data does support the conclusion that Roundtable editorial practices likely reinforce White perspective as a more legitimate news perspective than others.
I see anecdotal evidence of this in social media discussions about this series, in which people expressed expectations about which groups should appear in news discussions. For example, on a Facebook thread discussing my finding that Whites accumulated 7 times more appearances last year on The Roundtable than all non-White groups combined, user “Steve Manning” wrote, “Maybe that is because white people are more common than non-white people. Duh.” Reddit user “selsewon,” writing on the /Albany thread, rationalized Arab/MENA exclusion by stating, “hardly anyone is going to bat and [sic] eye at 0.7% of any population being overlooked”. These sorts of social media users (often angrily) implied that inclusion in news discussions should be proportional to the racial demographics of the larger community. Rationally informed by my above findings, I expect these same social media accounts will now angrily follow through on their commitments to proportionality and begin demanding greater inclusion of panelists-of-color on The Roundtable. LOL.
Other social media accounts offered openly racist statements endorsing exclusion of Palestinians from news discussions. Facebook account “Terry Gage,” for example, wrote “lol…’reasoned thoughts of Palestinians’…that’s hilarious.” The account Laurie Breyer Hobby wrote, “No one cares what terrorists and their enablers think.” These openly racist thinkers came to the defense of WAMC’s The Roundtable. I don’t think alliance with this deeply despairing and morally lost group is what WAMC desires or will benefit from, but it is the logical result of policies prioritizing White perspectives over all others. Active listeners working together to pressure station management can change that.
WAMC’s new CEO Sarah Gilbert can be reached at sgilbert@wamc.org
The Roundtable’s producer Sarah LaDuke can be reached at sladuke@wamc.org
Roundtable host Joe Donahue can be reached at jdonahue@wamc.org
GitHub data includes CSV files for all Roundtable data analyzed in this series as well as American Community Survey tables (from US Census Dept. Social Explorer) on area racial/ethnic demographics and population counts.
WAMC’s Community Representation Policy Statement states, “The overall goal of WAMC is to provide programming as varied as the human experience. Our mission is to serve the public by preparing and presenting non-profit and non-commercial educational, instructional, and cultural radio and live programs that celebrate the diversity of our broadcast and live audience. . . . In our journalism, diversity means the inclusion in our reporting of the vastly different voices and opinions of mis or under-represented people and those often ignored. WAMC strives to include differing opinions in our content. To do this, we consciously think of and discuss what diversity includes; race and ethnicity, gender, socio-economic status, faith, age, sexual orientation, disabilities, political affiliation and geographic location. In this way, our staff and content will continually evolve and ultimately be unbiased.”
Racial reporting for 37 Counties of WAMC’s broadcast area, included Native American/American Indian, American Community Survey 2022. Accessed through Social Explorer.
From the perspective of the 75% White proportion of the community broadcast area, the 85%-94% Roundtable inclusion rates are over-representations calculated as: (85-75)/75 and (94-75)/75.
Arab ancestry reporting for 37 Counties of WAMC’s broadcast area, American Community Survey 2019. Accessed through Social Explorer. For American Indian data see footnote 2.
Irizarrey’s comment starts at 1:17:33 in the audio recording provided by WAMC. https://www.wamc.org/podcast/the-roundtable/2024-09-19/9-19-24-live-panel-at-the-linda
Dr. Medina’s comment starts at 1:21:21 in the audio recording provided by WAMC. https://www.wamc.org/podcast/the-roundtable/2024-09-19/9-19-24-live-panel-at-the-linda


